So far in unit four we learned about t-charts and how to calculate the speed, time and distance of a projectile. We are still using the same variables from the last two units, which are:
d = distance (meters)
a = acceleration (gravity of Earth = 9.8 m/s2 or 10 m/s2)
t = time (seconds)
Vf = final velocity (m/s)
Vo = initial velocity (m/s)
And we are still using the kinematic equations we used in the last two units as well, they are:
d = (average V)t
d = ½ at2 + Vot
Vf = Vo + at
Vf2 = Vo2 + 2ad
T-charts list x-axis variables and y-axis variables, the variables are determined by the direction the object is going, anything going in a horizontal velocity/direction is a x-axis variable and anything going up or down velocity/direction is a y-axis variable. For example, a marble is pushed across a table at a velocity of 5 m/s and the height of the table is 2 meters. The velocity of the marble being pushed across the table is an x-axis variable, because its movement is horizontal (unless it's one of those funky Inspiration tables that are just there for ornamental value). The height of the table is a y-axis variable because the height of the table is the distance traveled when the marble falls off the table and the direction of the marble is then going downward.
Another way to know if something is an x or y-axis variable is by drawing out the direction of each variable. So, again, using the example of the marble this is what a drawing would look like….
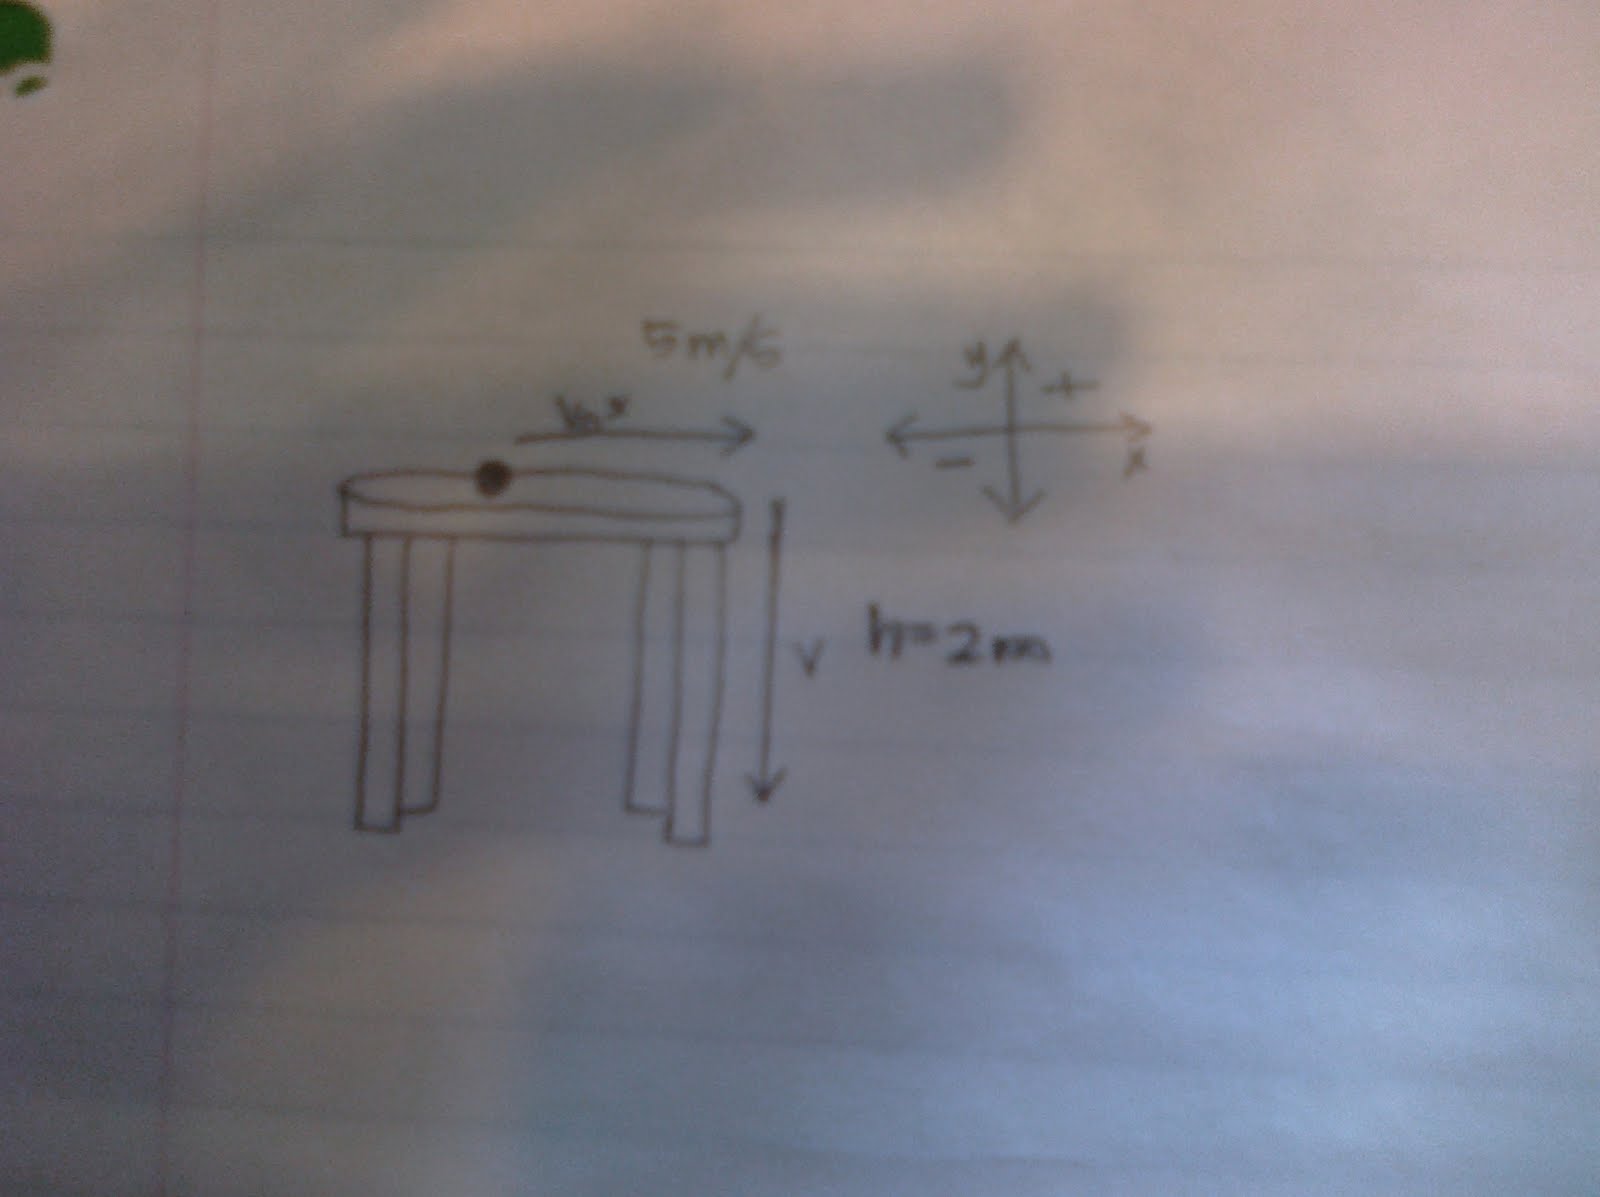
The small graph that has a + in QI and a – in QII shows you what axis each variable is. So by going left or right makes a variable part of the x-axis, by going up or down makes a variable part of the y-axis. The + means that if the object is going up or moving to the right then it's velocity is positive, and the – means that if the object is going down or moving to the left then its velocity is negative. I guess this makes more sense than my big paragraph but I really don't want to delete it.
Anyway when trying to calculate the motion of a projectile you write down the given variables in a t-chart and then use the kinematic equations to find the other variables. Using the situation from before, you already know
· the velocity of marble moving across the table (5 m/s)
· the acceleration of the marble moving across the table (0 m/s2), because the final and initial velocity doesn't change because the marble is moving horizontally
· the distance the marble will drop to the ground (-2 m), because it is falling downward the distance is negative
· the initial velocity when the marble falls off the table (0 m/s), because the marble is now free falling it has no initial velocity
· the acceleration of the marble during free fall (-9.8 m/s2), because, assuming that this place is on earth and earth's gravity pulls objects downward the acceleration is negative and equals -9.8 m/s2
With this in hand you can now fill out the t-chart, it should look like this:

Also, one exception to the values of the different sets of variables is that time is a constant and that both the x and y-axis share it.
To find the rest of the variables you must use the kinematic equations, here is how I found each variable….
 |
| Find the final velocity after the marble hits the ground. |
 |
| Finding the time it took the marble to fall to the ground. |
 |
| Finding the horizontal range as the marble falls to the ground. |
woooahh you wrote a lot! this is super good for review or just looking over! lots of notes!
ReplyDelete@Nalei: thanks, I was waiting for my mom to pick me up and had like 3 hours to kill so i basically did this....
ReplyDeleteYour posts are always really detailed! They really help me understand what I'm doing. Thanks Alexis! :)
ReplyDelete@Jess: I'm happy to know that they are helpful to you and that they aren't very long winded.
ReplyDeleteOh my goodness! This is a great explanation of the difference between x-axis and y-axis motions! The pictures are great diagrams to illustrate your points too. Very good detail and description in explaining how to solve the equations and other stuff. C: GOOD JOB, YO!!
ReplyDelete@Ari: domo, i had nothing else to do for three hours so i just focused in that.
ReplyDelete